How to Avoid Zero Anchor Loads from Piping
Why Software may show Zero Anchor Loads?
While stress analysis and supporting considerations it is always a better engineering practice to provide line stops or axial stops or anchors at the neutral point of the straight portion of the piping. It is believed that at the neutral point, thermal movement is zero and frictional resistance equalizes from both sides of the piping system. In such a scenario, the frictional forces cancel out as forces are positive at one side and negative at the other. Also as there is no thermal movement, there will be zero axial loads due to temperature effect. So, the software will show zero anchor loads in such locations.
Example of Zero Anchor Loads
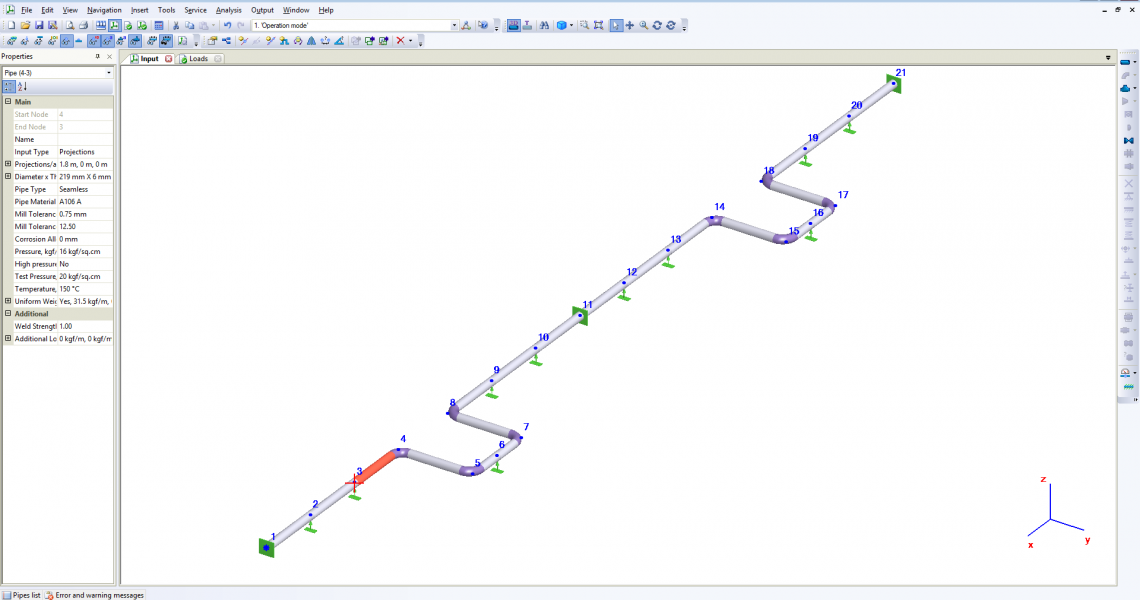
For example, In the following symmetric system with two U-shape loops as shown in Fig. 1, The leg length on both sides of the intermediate anchor is equal. Thus the intermediate anchor node 11 becomes a neutral point.

As can be seen in Fig. 2, The load along the pipe in an intermediate anchor (node 11) will be zero.

In reality, the piping heating up can be uneven, the friction forces can be different on the left and right part of piping, piping design can’t be ideal. Therefore, the real load on the anchor will not be zero.
How to Avoid Zero Anchor Loads?
To avoid such a situation the Anchor Factor “k” is used in piping stress engineering practice. The following method can be manually used in any pipe stress analysis software. In PASS/START-PROF piping stress analysis software this is a built-in function.
- If loads from pipes to the left and right of the support (N1 and N2) are in the same direction, they are combined as N1+N2
- If loads N1 and N2 are in different directions, the lower values are multiplied by k and then combined as N1+N2*k (|N2|<|N1|)
- If the support is on an end node, factor k is not used
Factor k applied only for loads in the horizontal plane: axial force, lateral force, horizontal moment.
The common value, that is recommended by some piping stress analysis codes is k=0.8. If we use 0.8 value the result will be as shown in Fig. 3. and Fig. 4.


The following training video shows how to create this model. It takes 2 minutes
Few more Resources for you..
Stress Analysis using Start-Prof
Stress Analysis using Caesar II
Piping Stress Analysis Basics
Piping Design and Layout
Piping Materials